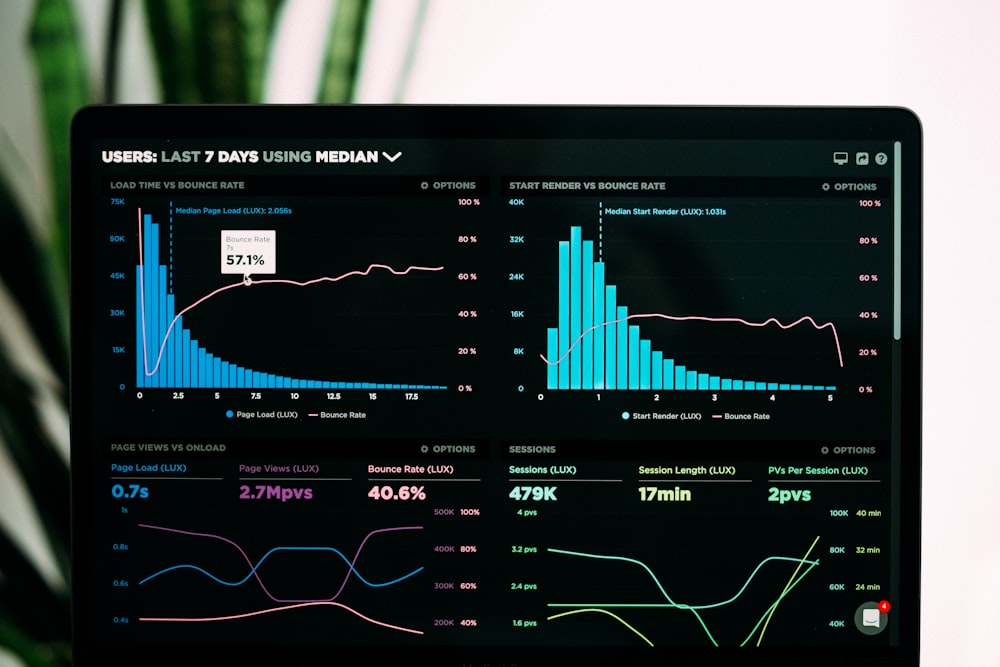
Unveiling Insights: The Power of Data Visualization
Data visualization stands as a cornerstone in modern analytics, offering a profound means of deciphering complex datasets and transforming them into meaningful insights. From business intelligence to scientific discovery, the applications of data visualization are far-reaching and impactful. In this article, we delve into the significance of data visualization and explore its various dimensions.
Understanding the Essence of Data Visualization
At its core, data visualization is the art of representing information graphically. Rather than sifting through rows and columns of raw data, visualization techniques allow us to interpret complex datasets swiftly and intuitively. By converting data into visual forms such as charts, graphs, and maps, we can identify patterns, trends, and correlations that might otherwise remain hidden.
Navigating Through Complex Data
One of the primary challenges in data analysis is dealing with the sheer volume and complexity of information. Here, data visualization serves as a guiding light, providing clarity amidst the chaos. Through carefully crafted visualizations, we can distill vast datasets into comprehensible visuals, enabling us to grasp key insights at a glance. Whether it’s sales figures, market trends, or scientific measurements, visualization simplifies the process of data interpretation.
The Evolution of Visualization Techniques
Over the years, data visualization has undergone a significant evolution, driven by advancements in technology and design principles. From traditional bar charts and pie graphs to interactive dashboards and immersive 3D visualizations, the landscape of data visualization continues to expand. Today, tools such as Tableau, Power BI, and D3.js empower analysts and researchers to create dynamic visualizations that facilitate deeper exploration and understanding of data.
Empowering Decision-Making
In the realm of business and decision-making, data visualization plays a pivotal role in informing strategic choices and driving organizational success. By presenting data in visually compelling formats, decision-makers can gain valuable insights into market trends, customer behavior, and operational performance. Whether it’s optimizing marketing campaigns, forecasting sales projections, or identifying cost-saving opportunities, data visualization empowers businesses to make informed decisions with confidence.
Bridging the Gap Between Data and Action
One of the key strengths of data visualization lies in its ability to bridge the gap between data analysis and action. By communicating insights in a visually engaging manner, visualization facilitates better communication and collaboration across teams and departments. Whether it’s presenting findings to stakeholders, sharing insights with colleagues, or mobilizing support for a particular course of action, visualization serves as a common language that transcends disciplinary boundaries.
The Impact on Scientific Discovery
In the realm of scientific research, data visualization serves as a catalyst for discovery and innovation. By visualizing experimental results, researchers can identify patterns, anomalies, and relationships that may lead to new insights or hypotheses. From mapping the spread of infectious diseases to visualizing the structure of complex molecules, visualization techniques enable scientists to explore the frontiers of knowledge and push the boundaries of human understanding.
Challenges and Opportunities Ahead
While data visualization offers immense potential, it also presents challenges and limitations that must be addressed. From ensuring data accuracy and integrity to overcoming biases in visual representation, there are various pitfalls to navigate in the realm of data visualization. Moreover, as datasets continue to grow in size and complexity, there is a growing need for scalable and efficient visualization techniques that can handle big data effectively.
The Future of Data Visualization
Looking ahead, the future of data visualization appears bright, fueled by ongoing innovations in technology, design, and data science. As artificial intelligence, machine learning, and augmented reality continue to reshape the digital landscape, we can expect to see new and exciting developments in the field of data visualization. From immersive virtual environments to real-time predictive analytics, the possibilities are endless, offering boundless opportunities for exploration and discovery. Read more about Data Visualization
